Extrema of piecewise linear functions
Hugo decided to expand his knowledge of linear functions.
He discovered that there is a special kind of linear functions called piecewise linear functions.
Like the "usual" linear functions they are continuous on their domains but unlike
the "usual" linear functions their first derivative is undefined in some points of their domains and
it is not continuous.
There are crests and troughs of various shapes on the graphs of piecewise linear functions and this
particular feature makes these functions more complex and more interesting.
To start his investigations, Hugo needs to locate the extremal points of the piecewise lilnear
functions. As the strict local extrema seem to him to be the most prominent features of the functions, he
wants to know them first.
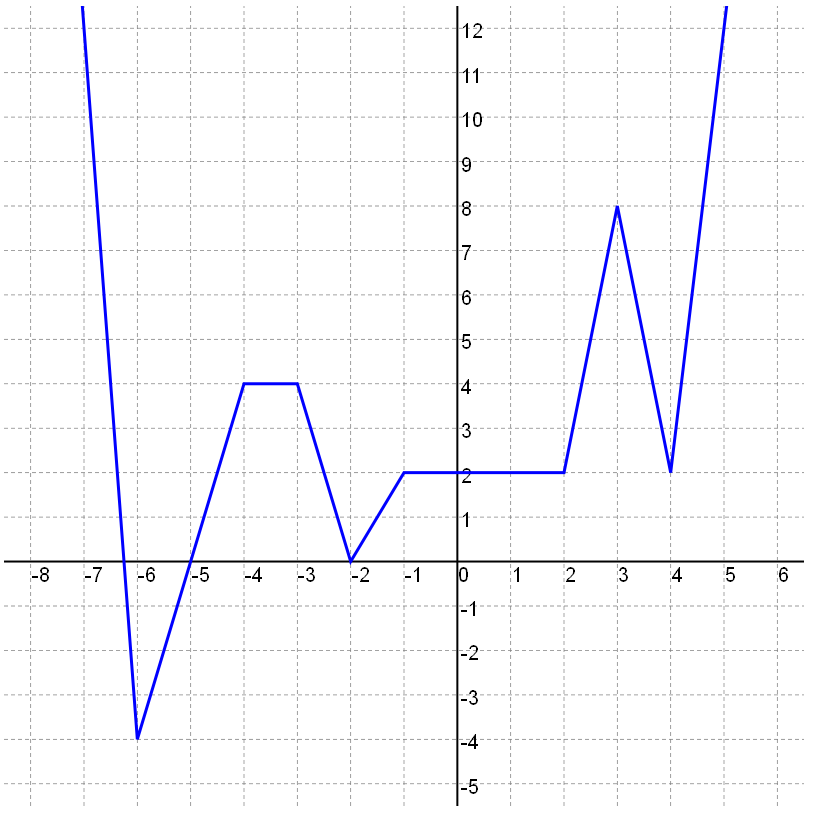 Image 1. Graph of the piecewise linear function defined by the formula f(x) = 2⋅||x + 4| − 2| − 6⋅|x − 3 + |x − 3|| + 8⋅|x − 4| + 3⋅|x − 2| − |x + 1| + |x + 2| − 2⋅|x + 3| + 8⋅|x + 6| + 3⋅x − 83. There are three strict minima with coordinates [−6, −4], [2, 0], [4, 2] and one strict local maximum with coordinates [3, 8]. |
The task
You are given a formula defining a piecewise linear function. Print out the coordinates of all strict local extrema of the function.
Input
The input consists of one text line containing a single unempty string. The string represents the right hand side
of the equality which defines a piecewise linear function of argument x. The string can contain only digit
characters, decimal point characters, argument characters 'x', symbols of operation '+' (plus), '-' (minus),
'*' (times), round brackets and vertical lines '|' (ASCII 124) denoting the absolute value. There are no
spaces in the string and its length does not exceed 107. The string is formed correctly
according to the standard mathematical notation.
More formally, the input is a term. It can be defined recursively as follows:
1. A number is a decimal part which may be followed by a fraction part. Decimal part is a
string containing nonzero number of digits 0, 1, ..., 9.
The first character of the decimal part may also be a minus sign '−'.
Fraction part is a string starting with a single decimal point character '.'
followed by a nonzero number of digits 0, 1, ..., 9.
The digits may repeat themselves and may be arranged in any order.
2. Any number is a term, character 'x' is a term.
3. Let P, Q be the terms and let C be a number.
Then also P+Q, P−Q,
C*P, P*C,
(P), |P| are terms.
The distance between any two points in which the derivatives of the function are undefined is at least
10−8. All nonzero slopes of all segments of the graph of the function are in
absolute value bigger than 10−8.
Output
The output consists of two text lines. The first line contains the list of all strict local minima of
the input piecewise linear function, the second line contains the list of all strict local maxima of
the same input function. The structure of both list is identical. The list starts with an integer
denoting the number of elements of the list. The integer is followed by the list items. Each item
consits of x-coordinate and y-coordinate of one strict extremum point of the function, the items are
sorted in ascending order of the x-coordinate. Each coordinate is a decimal number rounded to exactly three
decimal fraction digits. All values on the line are separated by space. All zero values shoud be
printed as 0.000 not as -0.000.
The size of any list does not exceed 5000, The absolute value of each coordinate is less than 10000.
Example 1
Input2*||x+4|-2|-6*|x-3+|x-3||+8*|x-4|+3*|x-2|-|x+1|+|x+2|-2*|x+3|+8*|x+6|+3*x-83Output
3 -6.000 -4.000 -2.000 0.000 4.000 2.000
1 3.000 8.000
The input function in the example 1 is depicted in the Image 1 above.
Example 2
Input(|x-8|+|x+7|+|x-6|+|x+5|+|x-4|+|x+3|+|x-2|+|x+1|+|x-1|)*0.25-10Output
1 1.000 -1.000
0
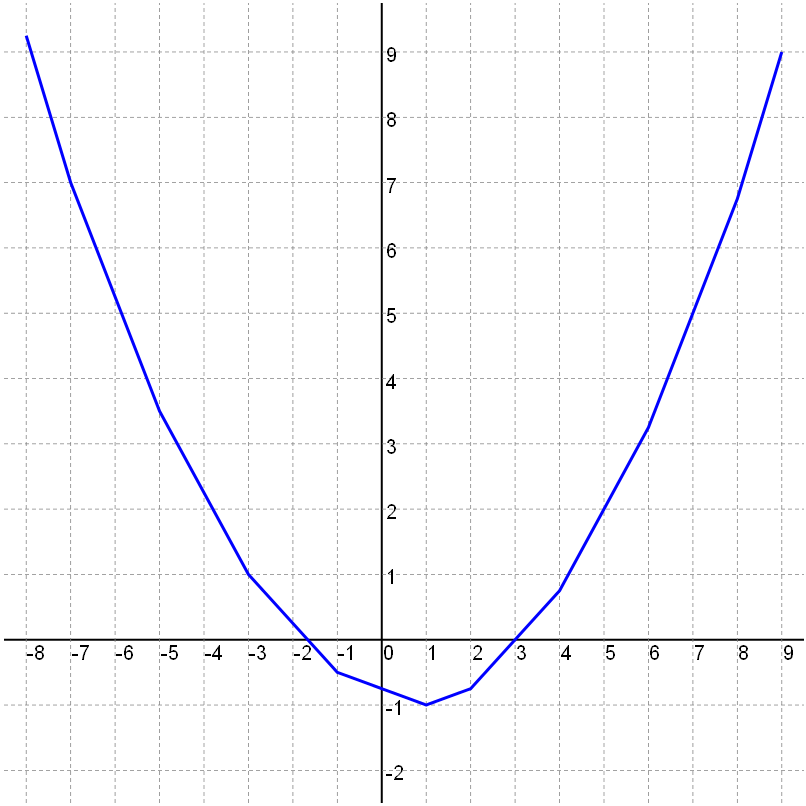 Image 2. Graph of the piecewise linear function defined in the example 2. |
Example 3
Input|||||||x|-32|-16|-8|-4|-2|+|||||x-33|-17|-9|-5|-3|-5|-2-14Output
4 12.000 -16.000 16.000 -14.000 20.000 -16.000 36.000 -16.000
0
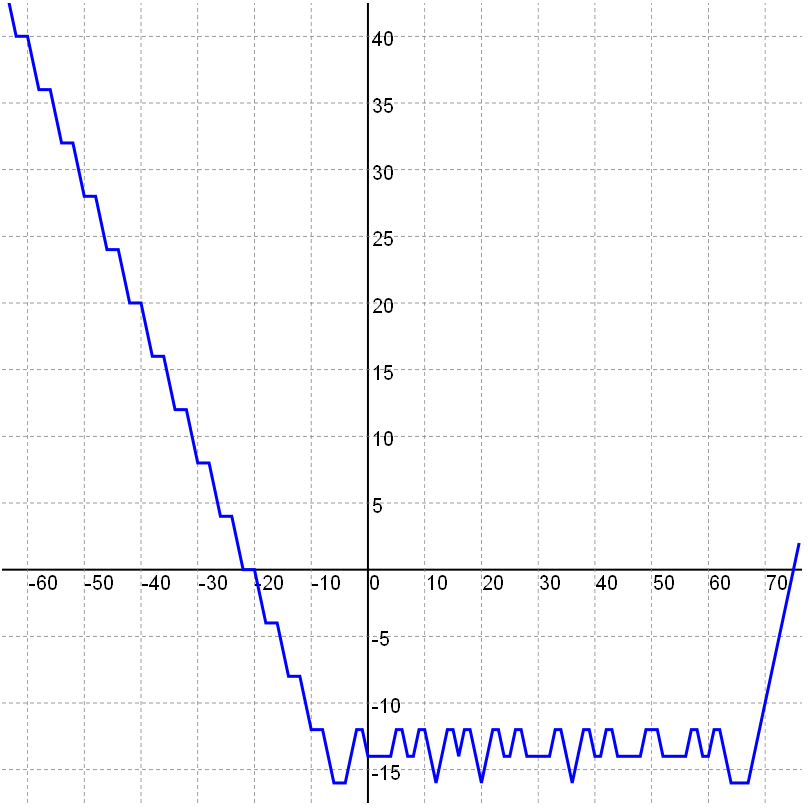 Image 3. Graph of the piecewise linear function defined in the example 3. |
Example 4
Input|x-11|*5.17+|x-14|*(-7.67)+|x-16|*5.83+|x-19|*(-6.67)+|x-22|*5.83+|x-24|*(-10.00)+|x-25|*7.5+|x-41|*5.5+|x-42|*(-11.00)+|x-43|*5.5+|x-55|*(-1.50)+|x-58|*1.5+|x-62|*(-1.25)+|x-64|*1.25+|x-100|*3.5+|x-102|*(-10.50)+|x-103|*14+|x-104|*(-10.50)+|x-106|*3.5-0*x+3Output
5 16.000 22.980 22.000 22.980 41.000 17.790 100.000 3.200 103.000 3.170
6 14.000 32.960 19.000 42.990 24.000 32.960 42.000 28.780 102.000 17.180 104.000 17.160
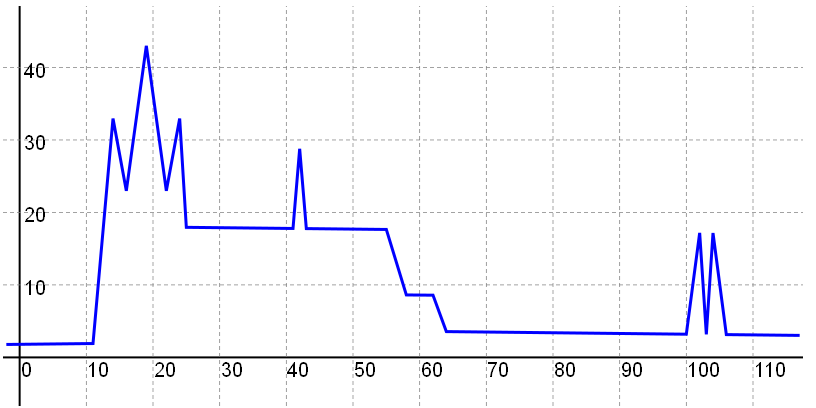 Image 4. Graph of the piecewise linear function defined in the example 4. Note that due to the relatively small image resolution some graph segments which are in fact slightly tilted seem to be horizontal. |
Public data
The public data set is intended for easier debugging and approximate program correctness checking. The public data set is stored also in the upload system and each time a student submits a solution it is run on the public dataset and the program output to stdout and stderr is available to him/her.
Link to public data set