Color Graph
Let us associate each node of a simple undirected graph with some color. This allows us to identify various types of edges. We say that an edge e is of type (c1, c2), if one of the endnodes of e is associated with color c1 and another is associated with color c2. Colors c1 and c2 might or might not be the same.
We say that two edges are incident if they share a common endnode.
We say that two edges e and f are adjacent if they are not incident and there exist at least one edge which is incident to both e and f.
We say that an edge e is an isolated adge if no edge of the same type as e is incident to e or adjacent to e.
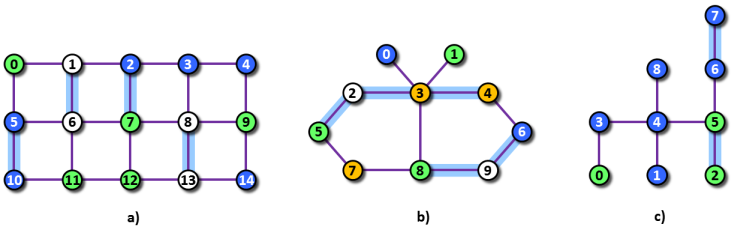 Image 1. Three graphs corresponding to Example 1, 2, and 3 below. Isolated edges in each graph are highlighted. Node colors in the examples are labeled by small integers. |
Â
The task
You are given a graph and a color of each its node. Count the number of isolated edges in the graph.
Input
The first input line contains three integers N, E, C separated by space and representing (in this order) the number of nodes in the graph, the number of edges in the graph and the number of node colors in the graph.
We assume that the nodes are labeled 0, 1, ..., N−1.
The next line contains N integers, separated by spaces, which represent the list of colors of particular nodes. The colors are listed in ascending order of node labels. The first integer represents the color of node 0, the second integer represents the color of node 1, etc. We assume that the colors are labeled 0, 1, ..., C−1.
Next, there are N −1 text lines, each specifies one edge in the graph. The line contains two integers, separated by space, which represent the labels of the edge endnodes. The edges are listed in no particular order.
It holds, 2 ≤ N ≤ 104, 1 ≤ E ≤ 106, 2 ≤ C ≤ 100.
Output
The output contains one text line with one integers representing the number of isolated edges in the input graph.
Example 1
Input15 22 3 1 2 0 0 0 0 2 1 2 1 0 1 1 2 0 0 1 1 2 2 3 3 4 5 6 6 7 7 8 8 9 10 11 11 12 12 13 13 14 0 5 1 6 2 7 3 8 4 9 5 10 6 11 7 12 8 13 9 14Output
4The graph in Example 1 is depicted in Image 1 a).
Example 2
Input10 11 4 0 1 2 3 3 1 0 3 1 2 0 3 1 3 2 3 3 4 2 5 4 6 5 7 6 9 7 8 8 9 3 8Output
5The graph in Example 2 is depicted in Image 1 b).
Example 3
Input9 8 2 1 0 1 0 0 1 0 0 0 0 3 1 4 2 5 3 4 4 5 5 6 6 7 4 8Output
2The graph in Example 3 is depicted in Image 1 c).
Public data
The public data set is intended for easier debugging and approximate program correctness checking. The public data set is stored also in the upload system and each time a student submits a solution it is run on the public dataset and the program output to stdout and stderr is available to him/her.
Link to public data set