Stable Components in a Color Graph
Let us associate each node of a simple undirected graph with some color.
Let v be a node and let c be a color. Denote by v(c) the set of all such nodes adjacent to v which color is c.
We say that a node v is stable when c1 is the color of v and |v(c1)| ≥ |v(c2)| for all colors c2 ≠ c1.
We say that an unempty set S of nodes in the graph is a stable component if:
- All nodes in S are stable.
- Either |S| = 1 or |S| ≥ 2 and any two nodes in S are connected by at least one path which nodes are all stable.
- When two nodes a ∈ S and b ∉ S are connected by an edge (a, b) then b is not stable.
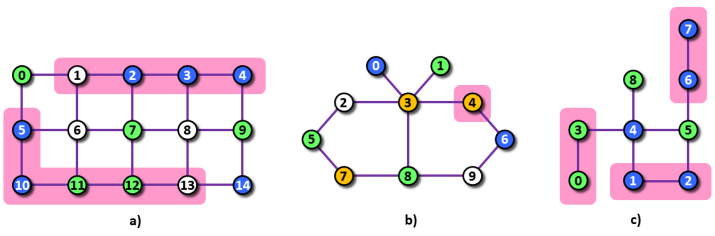 Image 1. Three graphs corresponding to Examples 1, 2, and 3 below. The stable components in each graph are highlighted. |
Â
The task
You are given a graph and a color of each its node. Determine the sizes of all stable components in the graph.
Input
The first input line contains three integers N, E, C separated by space and representing (in this order) the number of nodes in the graph, the number of edges in the graph and the number of node colors in the graph.
We assume that the nodes are labeled 0, 1, ..., N−1.
The next line contains N integers, separated by spaces, which represent the list of colors of particular nodes. The colors are listed in ascending order of node labels. The first integer represents the color of node 0, the second integer represents the color of node 1, etc. We assume that the colors are labeled 0, 1, ..., C−1.
Next, there are E text lines, each specifies one edge in the graph. The line contains two integers, separated by space, which represent the labels of the edge endnodes. The edges are listed in no particular order.
It holds, 2 ≤ N ≤ 104, 1 ≤ E ≤ 5×10⁵, 2 ≤ C ≤ 100.
Output
The output contains one or more lines. Each line contains two positive integers k, n separated by space. Value k denotes a number of nodes. Value n denotes the number of stable components of size k in the graph. The output lines are sorted in ascending order of k. All values k for which there exists at least one stable component of size k have to be listed. When the graph contains no stable component of some size k then no output line is printed for that value of k. In the problem data, there is always at least one stable component in each graph.
Example 1
Input15 22 3 1 2 0 0 0 0 2 1 2 1 0 1 1 2 0 0 1 1 2 2 3 3 4 5 6 6 7 7 8 8 9 10 11 11 12 12 13 13 14 0 5 1 6 2 7 3 8 4 9 5 10 6 11 7 12 8 13 9 14Output
4 1
5 1
The graph in Example 1 is depicted in Image 1 a).
Example 2
Input10 11 4 0 1 2 3 3 1 0 3 1 2 0 3 1 3 2 3 3 4 2 5 4 6 5 7 6 9 7 8 8 9 3 8Output
1 1The graph in Example 2 is depicted in Image 1 b).
Example 3
Input9 9 2 1 0 0 1 0 1 0 0 1 0 3 1 4 2 5 1 2 3 4 4 5 5 6 6 7 4 8Output
2 3The graph in Example 3 is depicted in Image 1 c).
Public data
The public data set is intended for easier debugging and approximate program correctness checking. The public data set is stored also in the upload system and each time a student submits a solution it is run on the public dataset and the program output to stdout and stderr is available to him/her.
Link to public data set