River Basin Experiment
Before we describe the current problem, let us remind you of some important hydrology concepts.
A river basin is the land area from which all water is collected and drained into a particular river.
A river begins at a spring which is a place where water emerges from the soil to the Earth's surface.
A tributary is a smaller river which flows into a bigger river.
A place where two rivers meet is called a confluence.
A place where a river meets a significantly large body of water, like a see or a lake, is called an estuary.
Note that at an estuary might be, in some cases, also a confluence of more rivers. In such case and solely for the purposes of this particular problem,
we formally consider all but one rivers to be the tributaries of the remaining, randomly selected, one.
A group of ecologists studies a basin of a large river. The basin contains the main river, also called the stem river, and many smaller rivers
which are tributaries of the stem river. Those tributaries have their own smaller tributaries and so on.
In order to better understand the ecosystem, the ecologists are preparing an experiment. They have three types of special liquids. They are going to select three different
river springs and pour the liquids into the springs. All three liquid types will be used and each spring will receive exactly one liquid type.
Next, the ecologists will monitor the river ecosystem for some time and take measurements.
The measurements are to be taken on so called sections. A section is a part of a river between two checkpoints.
There is a checkpoint at each tributary spring, a checkpoint at each confluence and also a checkpoint at the stem river estuary.
In addition, there might be some checkpoints established at important places along the rivers.
Unfortunately for the ecologists, whenever two or more liquids flow through one section of the river, the measurement taken on this section gets corrupted and the ecologists
cannot use it. They naturally want to be able to do as many measurements as possible, hence they want to choose the three river spings in a way which will maximize the number of sections through which only a single liquid will flow. See Image 1 for examples.
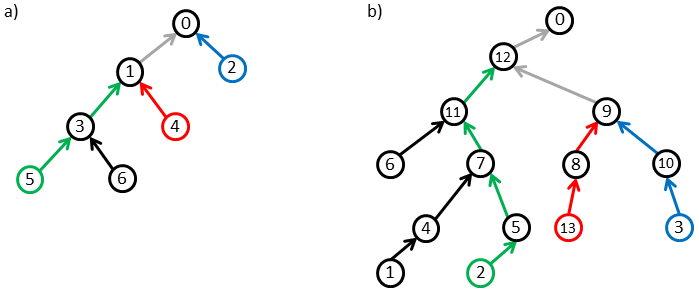
Image 1. Examples of optimal selections of springs. Checkpoints are represented by circles. Sections are represented by edges whose orientation follows the direction of the river flow. The stem river estuary is at checkpoint 0. Colors red, blue and green correspond to the three liquids. Sections where only one of the liquids flows are highlighted by these colors. Black edges represent sections where no liquid flows, gray edges represent sections where two or three liquids flow simultaneosly. a) An optimal solution is attained if the liquids are poured into springs 2, 4 and 5. b) An optimal solution is attained if the liquids are poured into springs 2, 3 and 13. Checkpoints 4, 5, 8 and 10 are examples of additional checkpoints established along rivers. |
The task
You are given a list of pairs of neighboring checkpoints, where each pair defines a river section. Find the maximum possible number of sections through which only a single liquid flows when all three liquids are poured into appropriately chosen springs.
Input
The first input line contains one integer N which represents the number of sections. Next, there are N lines, each of them specifies one section. A line consists
of two integers C and D separated by a space. These integers are identifiers of the checkpoints defining the segment. The checkpoint C is the one
closer to the river spring. The checkpoints are labeled from 0 to N, where 0 is always the checkpoint at the stem river estuary.
The sections are listed in the input in an arbitrary order.
The value of N is not greater than 1,5 × 10⁶.
It is guaranteed that there are at least three springs in the stem river basin.
Output
The output consists of one line containing one non-negative integer equal to the maximum possible number of sections through which only a single liquid flows after the liquids had been poured into chosen springs.
Example 1Input6 5 3 6 3 3 1 4 1 1 0 2 0Output 4The solution of Example 1 is visualized in Image 1a). |
Example 2Input13 12 0 11 12 9 12 6 11 7 11 8 9 3 10 10 9 1 4 4 7 2 5 5 7 13 8Output 8The solution of Example 2 is visualized in Image 1b). |
Example 3Input19 6 12 10 5 15 0 12 15 3 7 1 13 18 6 17 8 13 11 9 12 7 6 5 15 4 1 2 10 8 11 11 10 19 13 14 16 16 2Output 11 |
Public data
The public data set is intended for easier debugging and approximate program correctness checking. The public data set is stored also in the upload system and each time a student submits a solution it is run on the public dataset and the program output to stdout and stderr is available to him/her.
Link to public data set