Key Servers Statistics
The campus servers are connected into a single network in which the number of direct connections
between two neighbour servers is exactly the same as the number of the servers.
There are regular servers and key servers in the network.
From time to time, a statistics report describing various aspects of key servers performance has to be compiled.
The report is produced in the following way.
Each server is recognized by its unique numerical label.
The key server which label value is the lowest composes a report containing its own statistics
and sends it to some other key server.
Each key server which receives the report
appends its own statistics to the report, chooses some other
key server which has not received the report yet and sends the report to that key server through the network.
The last key server to receive the report appends its own statistics to the report and sends it back to the
first key server which initiated the process.
The report on a path from one key server to another might be transmitted by other key servers.
However, it is processed only by the key server which is the current receiver of the report.
All other key servers on the path do not process the report, they just mechanically
pass it on to the next server on the path.
The report transfer time between two directly connected servers is known and it is the same in both directions.
Report collecting time is the time elapsed between the departure of the report from the
key server which initiates the process and the time of final arrival of the report to that key server.
Report processing time at any server is not included in report collecting time as it is mostly negligible.
Report collecting time is not determined by the network topology only.
It also depends on the order in which the report is being sent from one key server to another.
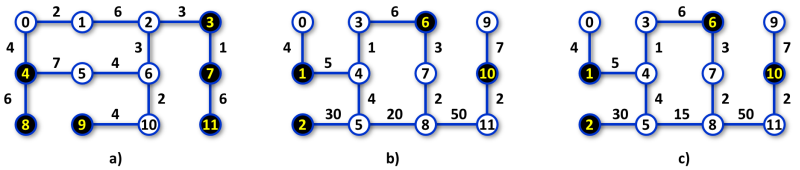 Image 1. Schemes of network connections a), b), c) depicting Examples 1, 2, 3 below, respectively. Key servers are drawn with light numbers on dark background. Report transfer times between directly connected servers are shown as values at corresponding connections. The minimum report collecting time is 70, 206, 205 in case a), b), c), respectively. In case a), a possible path of the report is 3 - 7 - 11 - 7 - 3 - 2 - 6 - 10 - 9 - 10 - 6 - 5 - 4 - 8 - 4 - 0 - 1 - 2 - 3. In case b), a possible path of the report is 1 - 4 - 5 - 2 - 5 - 4 - 3 - 6 - 7 - 8 - 11 - 10 - 11 - 8 - 7 - 6 - 3 - 4 - 1. In case c), a possible path of the report is 1 - 4 - 3 - 6 - 7 - 8 - 11 - 10 - 11 - 8 - 5 - 2 - 5 - 4 - 1. Note that there might be more paths resulting in minimum report collecting time. |
The task
You are given the network topology, a list of all key servers, and report transfer times between each pair of directly connected servers. Find the minimum possible report collecting time.
Input
The first line of input contains two integers N, K where N is the number of all servers in the network, K is the number of key servers in the network. The servers are labeled 0, 1, ..., N−1.Next, there are N lines, each line specifies one connection between two directly connected servers. The line contains (in this order) labels of two servers and the report transfer time between them. Finally, there is a line with a list of labels of all key servers.
The order of connections in the input is arbitrary. Also, the order of server labels on any line is arbitrary. All values on all lines are separated by spaces.
It holds, 2 ≤ N ≤ 106, 2 ≤ K ≤ 105, K ≤ N. All transfer times are positive integers less than 500.
Output
Output contains a single text line with the minimum possible report collecting time.
Example 1
Input12 6 0 1 2 1 2 6 2 3 3 4 5 7 5 6 4 9 10 4 0 4 4 4 8 6 2 6 3 6 10 2 3 7 1 7 11 6 4 8 9 3 7 11Output
70The network scheme of Example 1 is depicted in Figure 1 a).
Example 2
Input12 4 3 6 6 1 4 5 2 5 30 5 8 20 8 11 50 0 1 4 3 4 1 4 5 4 6 7 3 7 8 2 9 10 7 10 11 2 6 1 10 2Output
206The network scheme of Example 2 is depicted in Figure 1 b).
Example 3
Input12 4 3 6 6 1 4 5 2 5 30 5 8 15 8 11 50 0 1 4 3 4 1 4 5 4 6 7 3 7 8 2 9 10 7 10 11 2 6 1 10 2Output
205The network scheme of Example 3 is depicted in Figure 1 c).
Public data
The public data set is intended for easier debugging and approximate program correctness checking. The public data set is stored also in the upload system and each time a student submits a solution it is run on the public dataset and the program output to stdout and stderr is available to him/her.
Link to public data set